Larsen_EI_Development
The Development of the E:I Ratio: A Guide to the Analyses and Scripts.
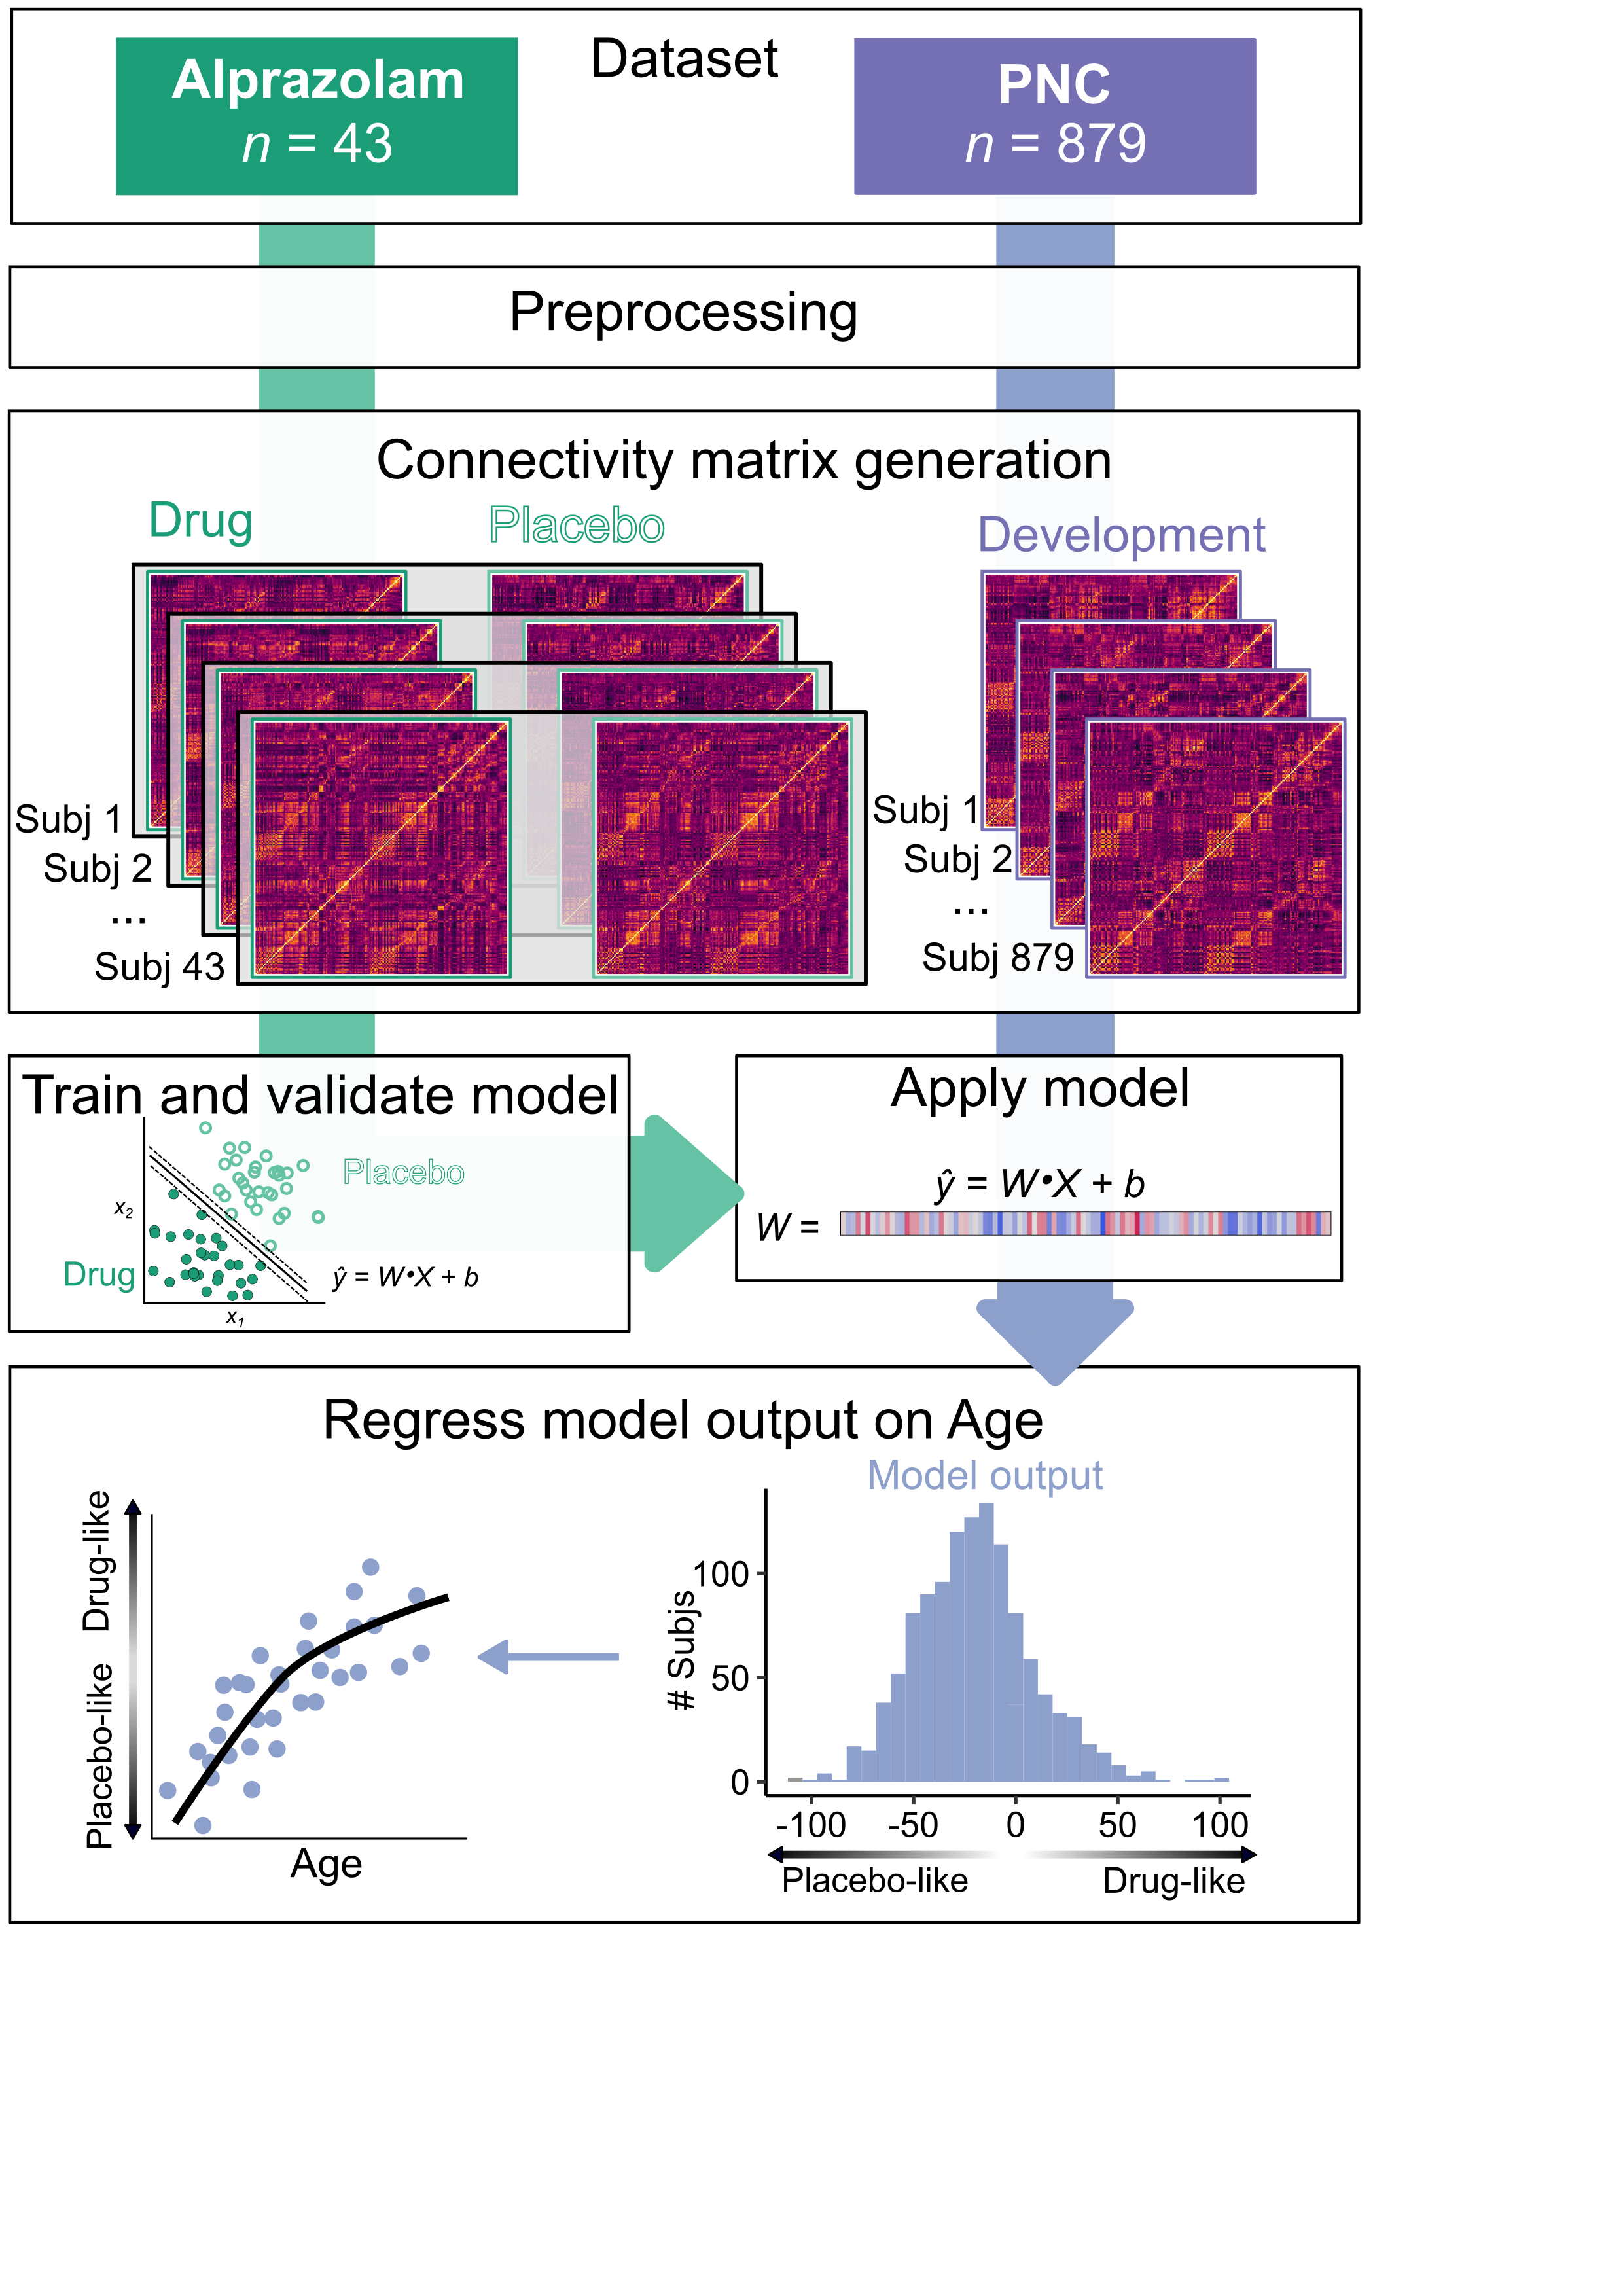
The goal of this project is to measure the development of the E:I ratio using fMRI. First, we use a pharmalogical imaging dataset with the GABAergic benzodiazepine alprazolam to empirically generate a multivariate model for the effect of shifts in the E:I ratio on patterns of fMRI connectivity. We then apply this model to a large developmental and assess how model-predicted E:I ratio changes with age. This is a guide to the scripts used to execute the primary analyses.
Requirements
The analysis scripts should be run on R version 4. It requires a number of R packages which are listed within the scripts contained here. R is free and quick to download here: https://www.r-project.org/
Data
Data is included within the input and output folders that is necessary to reproduce some of the key analyses. This includes the pharmacological classification in script 04 (however not the application to the PNC data, see below) and the developmental analyses in script 05.
Notes on run time
Script 04 takes hours or more to run on a single computer if permutation testing is on.
File overview
01: This downloads the output of all the flywheel processing (including fmriprep and XCP processing).
02: This generates connectivity matrices for all the existing parcellations we have. (Atlases were generated with createCoverageAtlash.sh).
03: These do the same as the above scripts but for all the PNC data.
04: This trains the classifier models and then applies them to the PNC data.
05: This evaluates the the results of the PNC model-generated labels and classification distances. It assesses age relationships as well as clinical relationships.
Notes on the steps for reproduction.
Steps 1-3 rely on SGE job submission for our cluster at Penn. The code is stored here for documentation purposes.
The scripts are numbered according to the order they should run.
-
This step downloads preprocessed data from flywheel to the local cluster.
-
This script launches
qsubjobs that generate connectivity matrices for all the pharmacological sessions and for all the atlases. The script uses AFNI’s3dNetCorrfunction. For convenience reasons with qsub, the actual call to3dNetCorris in the scriptnetcor_call.sh. -
The
03scripts do the same as step 1 and 2 for the PNC data. -
This script does the SVM classification. The primary analyses use 3 different classification models:
- a classifier with all regions.
- a classifier with transmodal areas only.
- a classifier with unimodal areas only
This should be run 3 times with different options each time.
First, set subdivide = FALSE and subdivision = "all".
Second, set subdivide = TRUE and subdivision = "transmodal25".
Last, set subdivide = TRUE and subdivision = "unimodal25".
More information about this is included in the script comments.
There is functionality to run permutation tests for each of these.
perm_test="permute_off" for no permutations.
perm_test="permute_on" for permutations.
This takes quite a while to run on a regular computer with the permutation testing on. Many hours at least. The dataframe for the PNC subjects is too large to be stored on github, so only the pharmalogical classification (not the application to the PNC dataset) can be performed using the available data here. The output of this analysis, however, is available in the output directory and can be used in step 05.
- Finally, this Rmd script takes the output from step
4and does some analyses.- It relies on the script
Alpraz_viz_functions.Rto make most of the figures/visualizations.- That script contains all of the functions to visualize classifier results.
- It also fits the GAM models for the age effects.
- It relies on the script