Project Information and Reproducibility Guide
View the Project on GitHub PennLINC/spatiotemp_dev_plasticity
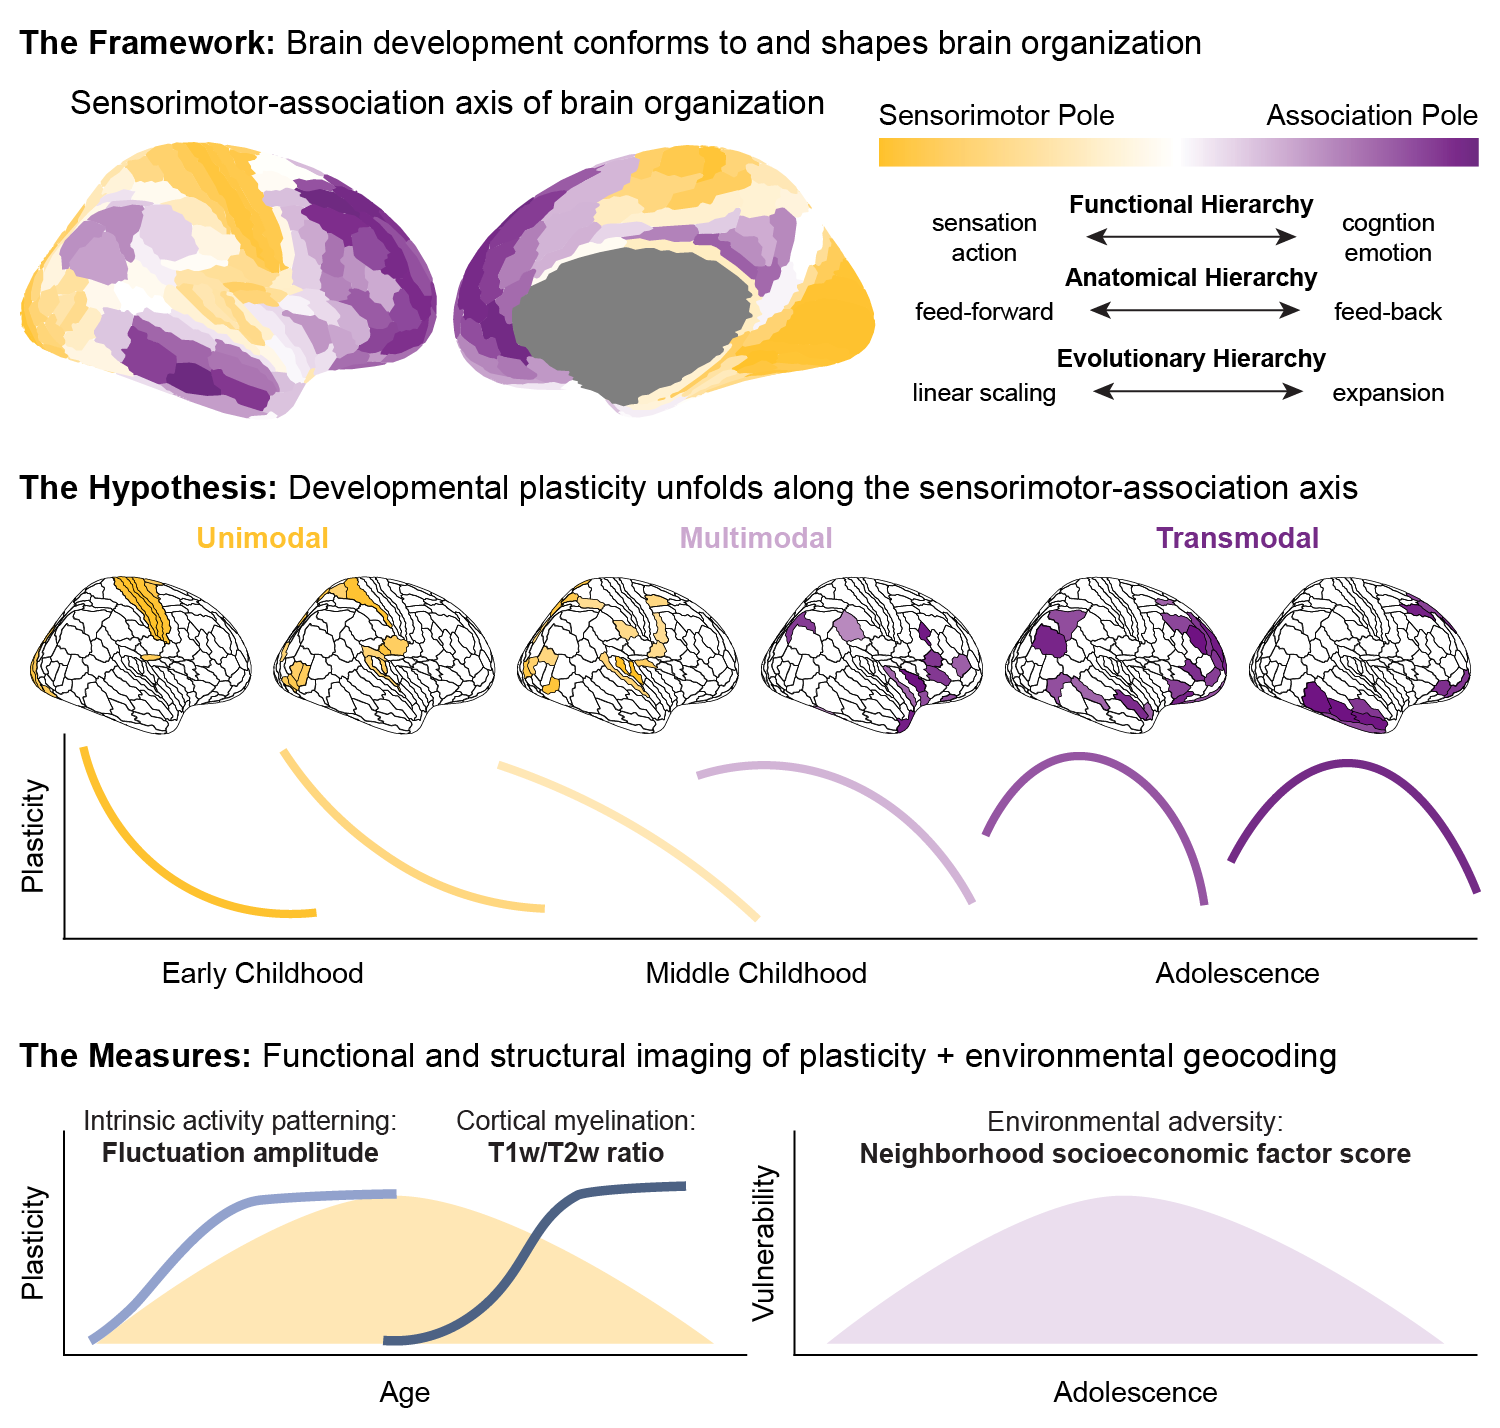
Intrinsic Activity Development Unfolds Along a Sensorimotor-Association Cortical Axis in Youth
Animal studies of neurodevelopmental plasticity have shown that intrinsic brain activity evolves from prevalent and synchronized to suppressed and sparse as plasticity declines and the cortex matures. Leveraging resting-state functional MRI data from 1033 individuals (8-23 years), we reveal that this stereotyped refinement of intrinsic activity occurs during human development and provides evidence for a cortical gradient of developmental plasticity during youth. Declines in the amplitude of intrinsic activity were initiated heterochronously across regions and coupled to the maturation of intracortical myelination—a key limiter of plasticity. Spatiotemporal variability in regional developmental trajectories was systematically patterned along a hierarchical, sensorimotor-association cortical axis from ages 8 to 18. The sensorimotor-association axis furthermore captured regionally-distinct associations between individuals’ neighborhood environments and intrinsic activity amplitude: findings suggest that youth from socioeconomically disadvantaged environments exhibit diminished differentiation of plasticity across this axis during mid-adolescence. Our results uncover a hierarchical axis of neurodevelopment and offer insight into the spatiotemporal progression of cortical plasticity in humans. Continued discovery of temporal axes of development across human’s multi-decade maturational course will provide evidence of how plasticity is distributed across brain regions at different developmental stages. Such insights into the temporal patterning of plasticity may help to guide interventions in youth that align with each child’s neurotemporal context.
Project Lead
Valerie J. Sydnor
Faculty Lead
Theodore D. Satterthwaite
Analytic Replicator
Bart Larsen
Collaborators
Bart Larsen, Jakob Seidlitz, Azeez Adebimpe, Aaron F. Alexander-Bloch, Dani S. Bassett, Maxwell A. Bertolero, Matthew Cieslak, Sydney Covitz, Yong Fan, Raquel E. Gur, Ruben C. Gur, David R. Roalf, Russell T. Shinohara, Allyson P. Mackey, Theodore D. Satterthwaite
Project Start Date
June 2021
Current Project Status
Published in Nature Neuroscience (2023) as Intrinsic activity development unfolds along a sensorimotor–association cortical axis in youth
Datasets
RBC PNC-Health Exclude (primary) and LTN (sensitivity)
Github Repository
https://github.com/PennLINC/spatiotemp_dev_plasticity
Conference Presentations
- Oral presentation Developmental Refinement of Spontaneous Activity Varies Across Sensorimotor and Association Cortices given in the “From the Womb to Wisdom” oral session at The Organization for Human Brain Mapping Annual Meeting, June 2022.
- Talk entitled Developmental Plasticity Unfolds Along a Sensorimotor-Association Gradient delivered at the Gradients of Brain Organisation Workshop, Cambridge University, UK, June 2022. A recording of the talk is available here.
- Flash talk selected for the Flux Society Congress, September 2022.
- Poster presented at The Society of Biological Psychiatry Annual Meeting, April 2022 as a Travel Awardee.
Cubic Project Directory
/cbica/projects/spatiotemp_dev_plasticity
CBF/: parcel-wise cerebral blood flow maps for each participant, generated with ASLPrep
code/: directory with the spatiotemp_dev_plasticity github repo
FluctuationAmplitude/PNC/: vertex-wise and parcel-wise fluctuation amplitude maps for each participant, generated with xcp-d and connectome workbench
FluctuationAmplitude/GAMRESULTS/: gam model outputs (effect sizes, p-values, fitted values, smooth estimates, smooth characteristics, derivatives)
Maps/: surface parcellation files and SNR masks (Maps/parcellations/) and S-A axis github repo (Maps/S-A_ArchetypalAxis/)
Myelin/: myelin development maps including the age effect size map (r2), the age of maximal growth map (age of max slope), and the annualized rate of change map (annualized roc) from Baum et al., 2021
sample_info/: sample demographics, factor scores, rbcid-bblid key, and final project participant list (PNC_FinalSample_N1033.csv)
software/: project software
Structural/: freesurfer output for each participant
Timeseries/: vertex-wise and parcel-wise fully processed resting fMRI timeseries data for each participant, generated with fmriprep and xcp-d
CODE DOCUMENTATION
The entire analytic workflow implemented in this project is described in the following sections and links to the corresponding github code are provided. This workflow includes quantification of regional fluctuation amplitude, PNC sample selection, fitting of generalized additive models (GAMs), and characterization of relationships between fluctuation amplitude, age, environmental variability, and the sensorimotor-association axis. Scripts were implemented in the order outlined below.
Fluctuation Amplitude Quantification
Resting state functional MRI data were processed with fmriprep 20.2.3 and xcp-d 0.0.4 to quantify fluctuation amplitude at each vertex on the fslr 32k cortical surface.
fmriprep 20.2.3 was run with the following parameters:
$ singularity run pennlinc-containers/.datalad/environments/fmriprep-20-2-3/image inputs/data prep participant --output-spaces MNI152NLin6Asym:res-2 --participant-label "$subid" --force-bbr --cifti-output 91k -v -v
xcp-d 0.0.4 was run with the following parameters:
$ singularity run pennlinc-containers/.datalad/environments/xcp-abcd-0-0-4/image inputs/data/fmriprep xcp participant --despike --lower-bpf 0.01 --upper-bpf 0.08 --participant_label $subid -p 36P -f 10 –cifti
Vertex-wise fluctuation amplitude maps were then parcellated with /fluctuation_amplitude/parcellate.Rmd to quantify mean fluctuation amplitude in each cortical region. Regions were defined with the HCP multimodal atlas (i.e. Glasser 360, primary analyses) and with the Schaefer 400 atlas (sensitivity analysis).
Fluctuation amplitude analyses were only conducted in brain regions that reliably exhibited high signal to noise ratio (SNR) in PNC functional MRI data. The vertex level SNR map generated in Cui et al., 2020, Neuron was parcellated with Glasser 360 and Schaefer 400 atlases with the script /fluctuation_amplitude/SNR_mask.Rmd for use in study analyses. Regions wherein >= 25% of vertices had attenuated signal were excluded from analyses.
Sample Construction
The final study sample was constructed with /sample_construction/finalsample.Rmd. The final sample was generated from the 1374 PNC participants with dominant group ses-PNC1_task-rest_acq-singleband scans (non-variant CuBIDS acquisitions). The following exclusions were applied to generate the final sample of N = 1033 participants:
Health exclude: 120 participants with medical problems that could impact brain function or incidentally-encountered brain structure abnormalities were excluded from the sample
T1 QA exclude: 23 participants with T1-weighted scans that failed visual QC were excluded from the sample
fMRI motion exclude: 179 participants with a mean relative RMS motion value > 0.2 during the resting state fMRI scan were excluded from the sample
Fluctuation amplitude outlier exclude: from the remaining 1052 participants, 19 individuals that had outlier (+- 4 SD from the mean) fluctuation amplitude data in more than 5% of Glasser 360 parcels were excluded from the sample
Model Fitting
GAM Functions
To characterize age-dependent changes in spontaneous activity fluctuations across the developing cortex as well as associations between fluctuation amplitude and environmental factors, generalized additive models were fit in each cortical region. GAM models and associated statistics, fitted values, smooths, and derivatives were quantified with the set of functions included in /gam_models/GAM_functions.R. This script includes the following functions:
- gam.fit.smooth: A function to fit a GAM (measure ~ s(smooth_var, k = knots, fx = set_fx) + covariates)) and save out statistics (smooth partial R squared and p-value) and derivative-based characteristics
- gam.smooth.predict: A function to predict fitted values of a measure based on a GAM model and a prediction data frame
- gam.estimate.smooth: A function to estimate zero-averaged gam smooth functions
- gam.posterior.smooths: A function to simulate the posterior distribution from a fit GAM model, calculate smooths for individual posterior draws, and determine smooth max and min median values + 95% credible intervals
- gam.derivatives: A function to compute derivatives for the smooth term from a main GAM model and for individual draws from the simulated posterior distribution; can return true model derivatives or posterior derivatives
- gam.fit.covariate: A function to fit a GAM (measure ~ s(smooth_var, k = knots, fx = set_fx) + covariate of interest + control covariates)) and save out statistics (partial R squared and p-value) for covariate of interest
- gam.varyingcoefficients: A function to estimate how the linear association between a predictor and y varies along a smooth function (varying coefficient interaction GAMs); can calculate associations (varying coefficient slopes) along the smooth function for the true model or for individual draws from the simulated posterior distribution
- gam.factorsmooth.interaction: A function to fit a GAM with a factor-smooth interaction and obtain statistics for the interaction term
Model Fitting: Age-Dependent Changes in Regional Fluctuation Amplitude
Developmental models were fit with gam_models/fitGAMs_fluctuationamplitude_age.R, which calls the functions described above. Age-focused GAMs were implemented for all regions included in the Glasser 360 and Schaefer 400 atlases, using the final study sample of N = 1033 generated during the sample construction process. Models examining the impact of participant pubertal stage on regional fluctuation amplitude were fit with gam_model/fitGAMs_fluctuationamplitude_pubertalstage.R.
Model Fitting: Developmental Environment-Dependent Variation in Regional Fluctuation Amplitude
Models examining age-independent (main effect) and age-dependent (interaction) associations between fluctuation amplitude and neighborhood socioeconomic circumstances were run via gam_models/fitGAMs_fluctuationamplitude_environment.R on the N = 1033 study sample.
Data Interpretation and Visualization
Model results were examined and studied within our hierarchical neurodevelopmental plasticity framework in the markdown file /developmental_effects/hierarchical_development.Rmd. This markdown executes the following:
- Generates all manuscript Figures
- Examines the cortical distribution and significance of associations between regional fluctuation amplitude and age
- Quantifies associations between developmental changes in fluctuation amplitude and in the T1w/T2w ratio
- Characterizes alignment of fluctuation amplitude age-related changes with the sensorimotor-association axis, including the magnitude and timing of change
- Calculates age smooths for 10 bins of the sensorimotor-association axis
- Performs a temporal sliding window analysis to uncover when developmental change in fluctuation amplitude is maximally aligned (and not aligned) with the sensorimotor-association axis
- Examines the significance and distribution of associations between regional fluctuation amplitude and environmental variability, and how environment effects are stratified by the S-A axis
A rendered html of hierarchical_development.Rmd can be viewed here!
Sensitivity Analyses
The robustness of our developmental findings was confirmed in a series of sensitivity analyses. Sensitiviy analysis GAMs were fit with sensitivity_analyses/fitGAMs_sensitivityanalyses.R and results were examined in sensitivity_analyses/sensitivityresults.Rmd. The following sensitivity analyses were performed:
- Low motion: Findings were assessed in a low motion sample of N = 690 participants with a relative mean RMS < 0.075
- Psychiatry exclusions: Findings were assessed in a sample that excluded participants with current psychotropic medication use or a history of psychiatric hospitalization
- Vascular control: All fluctuation amplitude models were re-fit while controlling for regional cerebral blood flow (quantified with ASL)
- T2 signal control: All fluctuation amplitude models were re-fit while controlling for regional BOLD signal level (T2*) during the fMRI scan as quantified with sensitivity_analyses/parcellated_meanT2star.R
- Normalization: Developmental GAMs were run with mean normalized fluctuation amplitude as the dependent variable
- Atlas: Results were reproduced using the Schaefer 400 atlas