Project Information and Code Reproducibility Guide
View the Project on GitHub PennLINC/sydnor_glucest_rewardresponsiveness_2020
GluCEST IMAGING OF REWARD RESPONSIVENESS
Glutamate-modulating psychotropics such as ketamine have recently shown efficacy for treating anhedonia, motivating interest in parsing relationships between glutamate and reward functioning. Moreover, rodent and non-human primate studies have demonstrated that antagonism of AMPA and group 1 metabotropic glutamate receptors decreases reward sensitivity, whereas optogenetic activation of reward network glutamatergic afferents is reinforcing. Despite this convergent evidence from clinical and preclinical studies suggesting that glutamate availability may modulate reward responsiveness, validation of such a relationship in humans has been difficult, given limitations in our ability to study glutamate in the human brain. In this project, we therefore capitalize on the novel, ultra-high field imaging method GluCEST (Glutamate Chemical Exchange Saturation Transfer), which offers enhanced sensitivity, spatial coverage, and spatial resolution for imaging glutamate in vivo. Specifically, this project capitalizes on GluCEST data collected at 7T from a transdiagnostic population (healthy, depression, psychosis-spectrum) to test the hypothesis that lower levels of glutamate within the brain’s reward network are dimensionally associated with diminished reward responsiveness. Given that diminished reward responsiveness is linked to poor psychological wellbeing, psychiatric disorder risk, suicidal ideation, and psychotropic treatment resistance, understanding the neural mechanisms underlying this clinical phenotype is vitally important.
Project Lead
Valerie J. Sydnor
Faculty Leads
David R. Roalf
Theodore D. Satterthwaite
Analytic Replicator
Bart Larsen
Collaborators
Christian Kohler, Andrew J. D. Crow, Sage L. Rush, Monica E. Calkins, Ruben C. Gur, Raquel E. Gur, Kosha Ruparel, Joseph W. Kable, Jami F. Young, Sanjeev Chawla, Mark A. Elliott, Russell T. Shinohara, Ravi Prakash Reddy Nanga, Ravinder Reddy, Daniel H. Wolf
Project Start Date
September 2018
Current Project Status
Published in Molecular Psychiatry (2021) as Diminished reward responsiveness is associated with lower reward network GluCEST: an ultra-high field glutamate imaging study
Datasets
818621 - SYRP, 828612 - URF, 825940 - GluCEST in Psychosis, 825834 - satterttPiloting
Github Repository
https://github.com/PennLINC/sydnor_glucest_rewardresponsiveness_2020
Path to Data on Filesystem
/data/jux/BBL/projects/sydnor_glucest/GluCEST_BASReward_Project
Publication DOI
https://doi.org/10.1038/s41380-020-00986-y
Conference Presentations
- Symposium at The Schizophrenia International Research Society Annual Meeting, April 2021. Imaging Glutamate in Schizophrenia: Novel Methods and Big Data.
- Oral presentation at the The Organization for Human Brain Mapping Annual Meeting, June 2020. Lower Reward Network Glutamate is Associated with Diminished Reward Responsiveness.
- Poster presentation at The Society of Biological Psychiatry Annual Meeting, May 2020. Reward Network Glutamate Level is Associated with Dimensional Reward Responsiveness. https://doi.org/10.1016/j.biopsych.2020.02.567
- Poster presentation at The 8th International Workshop on Chemical Exchange Saturation Transfer Imaging, November 2020. GluCEST Imaging of the Reward Network Provides Novel Evidence of a Relationship between Brain Glutamate and Reward Responsiveness in Humans.
CODE DOCUMENTATION
The steps below detail how to replicate all aspects of this project, from neuroimage processing to statistical anlysis and figure generation.
Image Processing
- Generate B0 maps, B1 maps, and B0- and B1-corrected GluCEST maps with the Matlab Program cest2d_TERRA_SYRP (in-house software).
-
Run /Processing_Pipeline/MP2RAGE_Processing_Pipeline.sh to process raw 7T Terra MP2RAGE structural data.
This script executes the following: UNI and INV2 dicom to nifti conversion, structural brain masking, ANTS N4 bias field correction, FSL FAST (for tissue segmentation and gray matter probability maps), UNI to MNI registration with ANTS SyN (rigid+affine+deformable syn)
-
Run /Processing_Pipeline/GluCEST_Processing_Pipeline.sh to process the 7T Terra GluCEST data output by cest2d_TERRA_SYRP.
This script executes the following: dicom to nifti conversion for Matlab generated B0 maps, B1 maps, and B0B1-corrected GluCEST dicoms, B0 and B1 map thresholding of GluCEST images, CSF removal from GluCEST images, GluCEST brain masking, registration of atlases from MNI space to participant UNI images, registration of FAST segmentation and reward atlas slices to GluCEST images, generation of reward network anatomical and valence-encoding subcomponent masks
- Run /Processing_Pipeline/RewardNetwork_Heatmap.sh to generate a reward network map that only includes voxels for which greater than 50% of participants had GluCEST data (used for coverage sensitivity analysis).
Measure Extraction
-
Execute /Measure_Extraction/GluCEST_Measure_Extraction.sh to calculate GluCEST % contrast and gray matter density measures for each subject in all masks of interest.
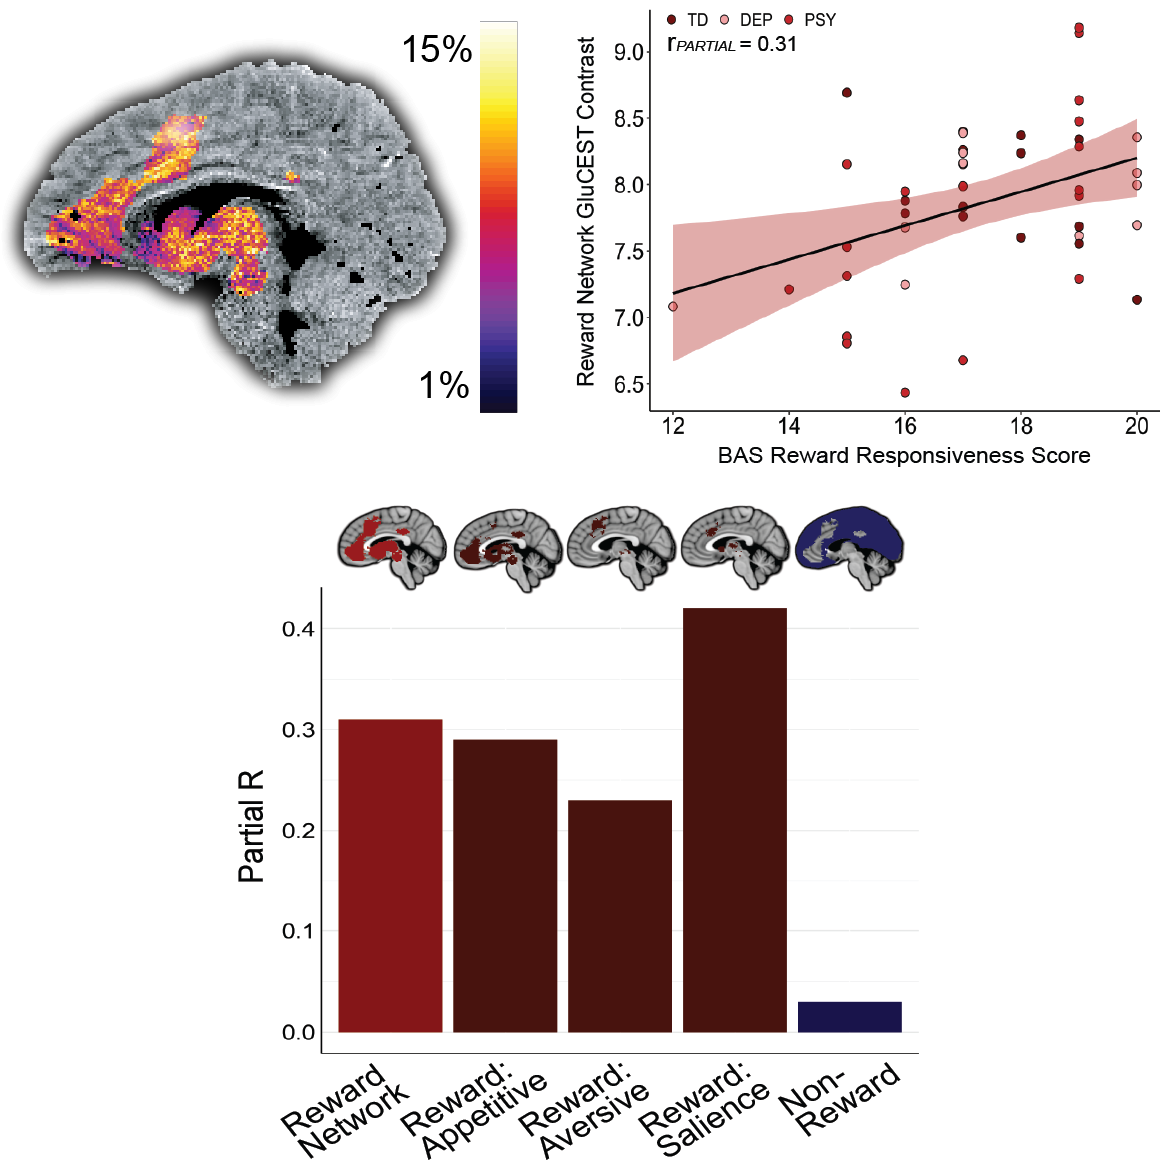
This script calculates the average GluCEST % contrast in the total reward network (Figure 2), reward network cortical and subcortical components (Figure 3), reward network appetitive, aversive, and salience subcomponents (Figure 4), non-reward cortex (Figure 4), and reward network anatomical subdivisions (Supplementary Figure S1). It additionally calculates average gray matter density in the total reward network
- Execute /Measure_Extraction/Calculate_RewardNetwork_PercentCoverage.sh to calculate the percent of the total reward network included in each participant’s GluCEST acquisition (used for coverage sensitivity analysis).
- Execute /Measure_Extraction/HMRSVOI_Coverage_CESTspace.sh to process the HMRS VOI and align it to GluCEST space. Next run Measure_Extraction/HMRSVOI_CEST_Measure_Extraction.sh to calculate the average GluCEST % contrast within the total HMRS VOI, as well as within reward and non-reward VOI components. Finally, run Measure_Extraction/HMRSVOI_Coverage_MP2RAGEspace.sh to calculate the percent of the HMRS VOI that is occupied by reward network versus non-reward cortex.
Statistical Analysis and Figure Generation
-
Knit /R_Statistics/Prepare_Demographics_ClinicalMeasures_Data.Rmd.
This script first reads in clinical (RedCap) data, isolates self-report scales, and calculates Behavioral Activation System (BAS) Scale Reward Responsiveness scores, BAS Drive scores, BAS Fun Seeking scores, PROMIS Depression scores, and PRIME Screen-Revised scores. It next reads in participant demographics and image quality assurance check results, and identifies the final study sample by 1) including only timepoint 1 imaging data, 2) including only participants with GluCEST data that passed all QC checks, and 3) excluding participants missing clinical (or GluCEST) data. It then generates the final study sample (SCANID-Timepoint1-PassQC.csv) and writes out a master clinical and demographic spreadsheet for this sample. Note, this R script calls the shell script extract_sample_7TClinicalMeasures.sh
- Knit R_Statistics/StudySample_Demographics_ClinicalMeasures_Overview.Rmd to generate the data presented in Table 1.
-
Knit R_Statistics/GluCEST_RewardNetwork_BASRR_Statistics.Rmd to conduct GluCEST-RR statistical analyses and generate study Figures.
This script conducts all statistics reported in the Results sections “BAS Reward Responsiveness indexes RR across typically developing and clinical groups”, “Reward network GluCEST does not differ between typically developing and clinical groups”, “Reward network GluCEST is dimensionally associated with RR”, “Association between reward network GluCEST and RR is driven by subcortical regions”, “Reward network GluCEST findings are influenced by valence encoding”, “Sensitivity analyses provide convergent results”, and “Reward network GluCEST associations are specific to the construct of RR” and generates the scatterplots and bar plots presented in Figures 2, 3, 4, and S1
-
Knit R_Statistics/GluCEST_HMRS_MethodologicalComparison_Statistics.Rmd to implement the GluCEST versus HMRS methodological comparison.
This script conducts all statistics reported in the Results section “GluCEST and single voxel 1HMRS demonstrate cross-method agreement” and in the Supplementary Information section “GluCEST and Single Voxel 1HMRS Demonstrate Cross-Method Agreement: Extended Methodology and Results”. Note, this R script calls on the shell script extract_sample_HMRSMeasures.sh
-
Knit R_Statistics/GluCEST_DiagnosticGroup_ROI_Statistics.Rmd to perform diagnostic group-based regional analyses.
This script conducts all statistics reported in the Supplementary Information section “Diagnostic Group Differences in Regional GluCEST and Relationships to Prior 7.0T 1HMRS Case-Control Studies”